Take Your Learning to the Next Level! See More Content Like This On The New Version Of Perxeive.
Get Early Access And Exclusive Updates: Join the Waitlist Now!
Take Your Learning to the Next Level! See More Content Like This On The New Version Of Perxeive.
Get Early Access And Exclusive Updates: Join the Waitlist Now!
In this section we will take a look at the most important input in to the pricing formula of an fx option. Volatility is the key input to the pricing formula and is what distinguishes FX options from other FX products. To get the most from this section you should first have covered the relevant previous sections and in particular options valuation, option risk characteristics and gamma.
The interbank options market trades European options on volatility not on premium. When two traders agree a deal they agree a volatility price. The traders agree a spot price, forward points and deposit and use a pricing tool to see what premium that implies. In order to lock in that price the trader’s exchange the spot delta hedge. That is, since they are on opposing sides of the trades, whatever one needs to do on the delta hedge the other needs to do the opposite and so they simply agree a spot transaction at the rate they agreed to calculate the premium.
This is only possible because the market agrees on a common model for calculating European style vanilla options. The market universally accepts the traditional Black-Scholes model (incorporating the Merton and Garman-Kohlhagen adjustments for index/currency options).
That is not to say that the model is perfect, rather that traders prefer to adjust the inputs to an imperfect model and agree on the model rather than having a proliferation of models. It is this acceptance of a common model and the conventions of exchanging delta that enabled the Over-The-Counter market to grow far beyond the size of the exchange based markets.
When traders trade on volatility it is in the interests of the buyer of volatility to set the spot price as quickly as possible. As we have already seen, option traders are trading volatility as an asset, not the underlying and keep themselves delta hedged. The buyer of volatility will be long gamma and the sooner spot is set the sooner he can benefit from any movements in spot.
The converse is true of the seller of options who would rather set the spot price as late as possible.
If a client is trading on volatility it is important to remember that if we get given on our volatility price we should agree the level of spot immediately the client hits our price.
If the currency pair is less liquid and the spreads in the forward markets are wide the option traders may exchange the forward delta. If clients trade less liquid markets on volatility it may be necessary to exchange forward delta. This is because in liquid currency pairs all the volatility comes from the movement in spot and the interest rate differentials are relatively stable. However, in less liquid currencies the interest rate volatility can be significant and is material when compared to the volatility of spot. In this case the volatility comes from the volatility in the outright forward and it is the forward that must be continuously hedged.
This section is intended to introduce the most important input to the options pricing model – volatility. An understanding of volatility is key to an understanding of options. Understanding volatility is also important for advising clients, as this is a common area for questions from clients.
A statistical measure of the tendency of a market price or yield to vary over time. Volatility, usually measured by the variance or annualised standard deviation of the price, rate, or return, is said to be high if the price, yield or return typically changes dramatically in a short period of time. Volatility is one of the most important elements in evaluating an option, because it is usually the only valuation variable not known with certainty in advance.
Volatility is a measure of the markets uncertainty about the speed and the magnitude of future changes in the price of the underlying asset. Options valuation is essentially a question of estimating the probability of spot finishing beyond certain levels at expiration. Volatility reflects the range of values over which it is expected that spot could trade in a given period.
The are two types of volatility that are of interest:
Historical volatility is a calculated number of actual historical prices. It is a statistical measure of actual price movements. In currencies, it is the returns on the outright forward that are measured. Traders use historical volatilities to compare against the implied volatilities trading in the market.
Implied volatility is the name given to the volatilities that are traded in the market. Options trading existed on exchanges before pricing models were developed. When options pricing models were developed they required volatility as an input. The prices on the exchanges could be used with pricing models to back out the effective volatility implied by the price of an option on the exchange. This volatility became known as implied volatility. As trading moved towards the OTC market, a convention developed whereby couterparties exchanged delta’s on trades and agreed other market inputs. The only variable remaining was the level of volatility, so volatilities themselves became a tradable commodity.
Actual volatility looks back at what happened in the market over a given period. Implied volatility is the market’s estimation of future price changes for a given period.
Out of-The-Money (“OTM”) Volatility Versus At-The-Money (“ATM”) Volatility The volatility required to price a particular option depends on the strike price of the option. Typically, volatilities for OTM options are greater than ATM volatility. Usually, the more Out-Of-The-Money the option, the higher the volatility will be.
The volatility for a Strangle is a measure of how much the OTM volatilities are trading above the ATM volatility. The fact that OTM volatilities trade at higher levels than ATM volatilities is referred to as kurtosis. Kurtosis is a result of the pricing model undervaluing OTM options. To correct for the pricing model undervaluing OTM options traders need a way to increase the price that the pricing model calculates. The way in which traders do this is to increase the main input to the model – volatility. This effectively means that there is a higher probability of large moves occurring than the pricing model would normally predict.
One of the assumptions of the Black-Scholes pricing model is that volatility is constant. However, the level of volatility fluctuates over time. Since the sensitivity of OTM option prices to volatility (vega) changes as volatility changes, a trader needs to hedge his vega position as volatilities change. This hedging activity results in a cost to the seller of OTM options and a gain to the buyer of OTM options. The additional cost to the seller of OTM options is reflected in the volatility difference between strangles and straddles (ATM options).
In addition to OTM volatilities being higher than ATM volatilities, OTM calls and puts of the same delta can have different volatilities. This effect is displayed in the price of a risk reversal. The effect can be caused in various ways:
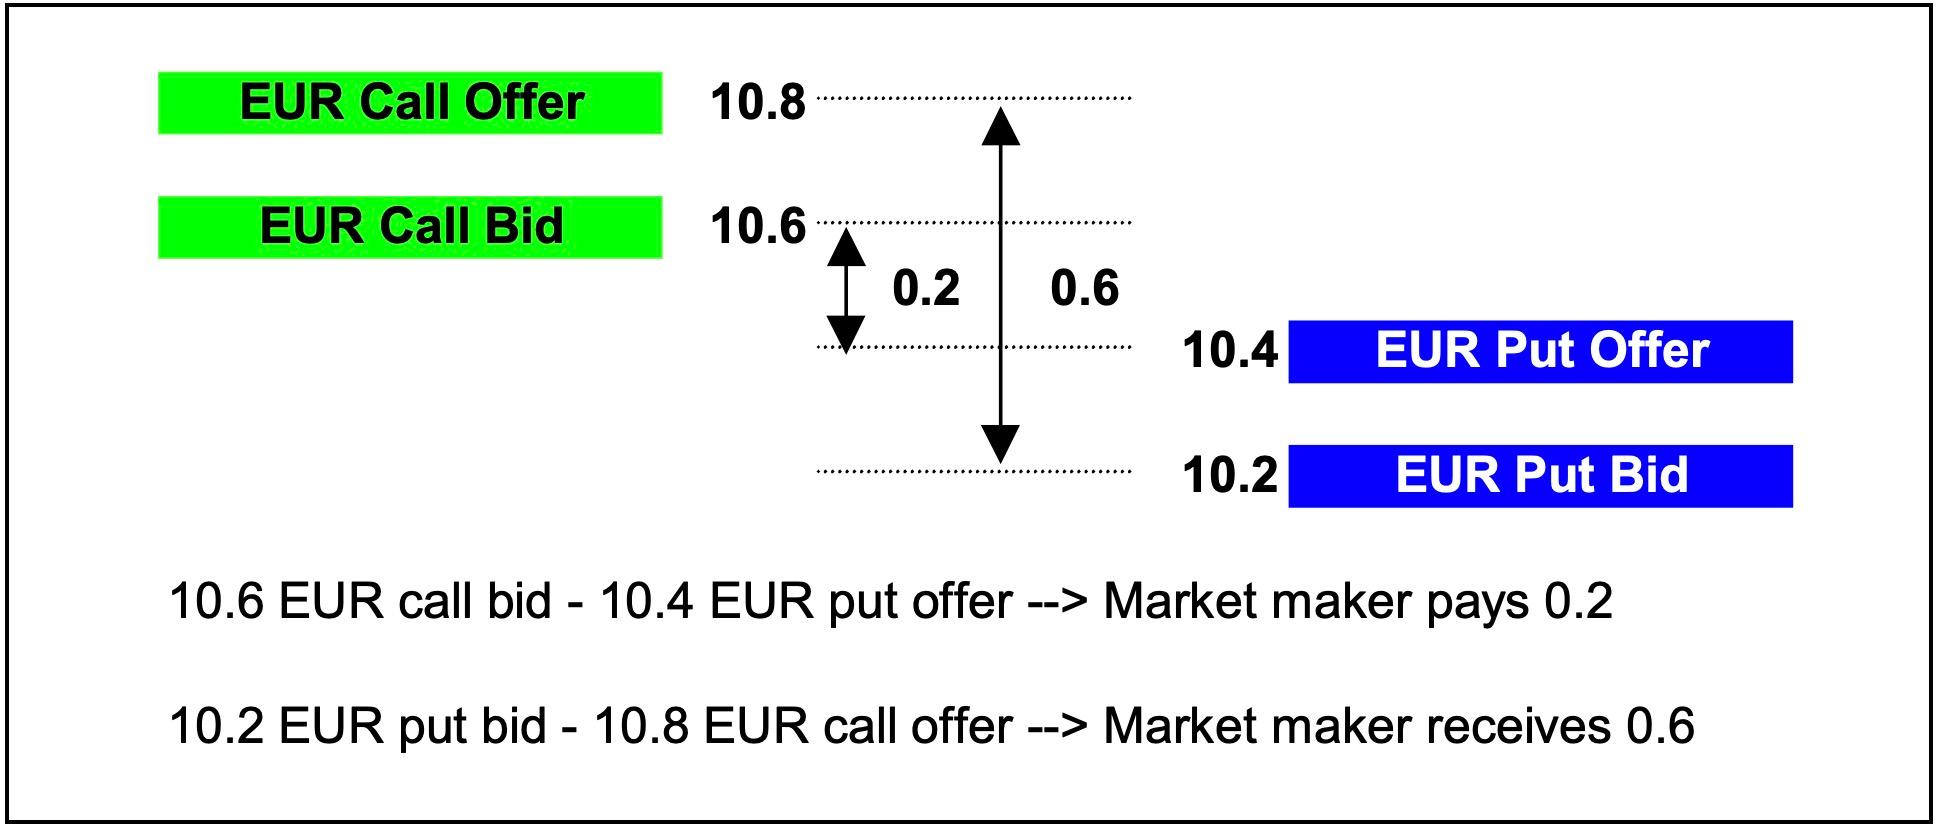
Risk reversal volatilities are quoted as a volatility spread, e.g. “0.2/0.6 EUR calls over”. In EUR/USD this would imply that EUR call / USD puts are trading at a higher level than EUR puts / USD calls. In this case the price tells us that the market maker is bidding the EUR calls two tenths of a vol higher than he is offering the EUR puts. The price also tells us that the market maker is offering the EUR calls six tenths of a volatility above the bid of the EUR puts. Note that the risk reversal price tells you nothing about the absolute level of volatility.
In the above scenario where the risk reversal price is 0.2/0.6 EUR calls over, the component volatilities could, for example, be 10.2/10.4 for the EUR puts, and 10.6/10.8 for the EUR calls.

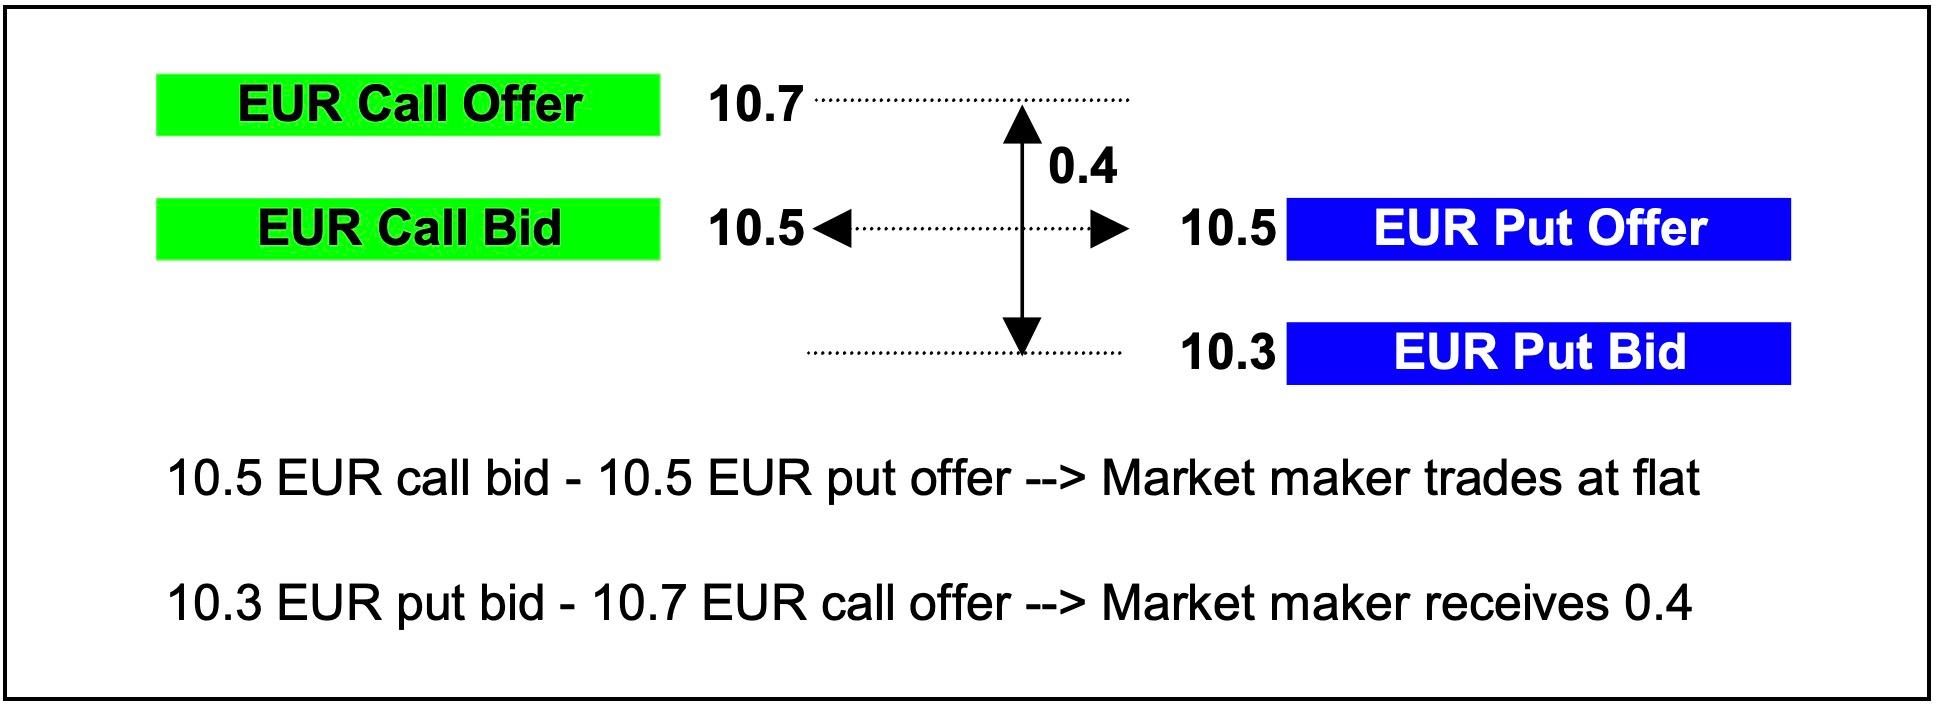
If the demand for EUR calls eased, and the prices moved to 10.3/10.5 for the EUR puts, and 10.5/10.7 for the EUR calls the risk reversal price would then move to “-/0.4 EUR calls over”. That is, market makers will buy the EUR calls at the same price as they will sell EUR puts, and offer the EUR calls four tenths over the bid of the EUR puts.

Taking the example a step further, if the demand for EUR calls eases still further and the prices move to 10.4/10.6 for the EUR calls, and 10.4/10.6 for the EUR puts the price for the risk reversal changes to “0.2 around”. That is, market makers are bidding 10.4 for both EUR calls and EUR puts, and offering EUR puts and EUR calls at 10.6. Therefore, whatever market makers do on the risk reversal they earn two tenths of a vol.

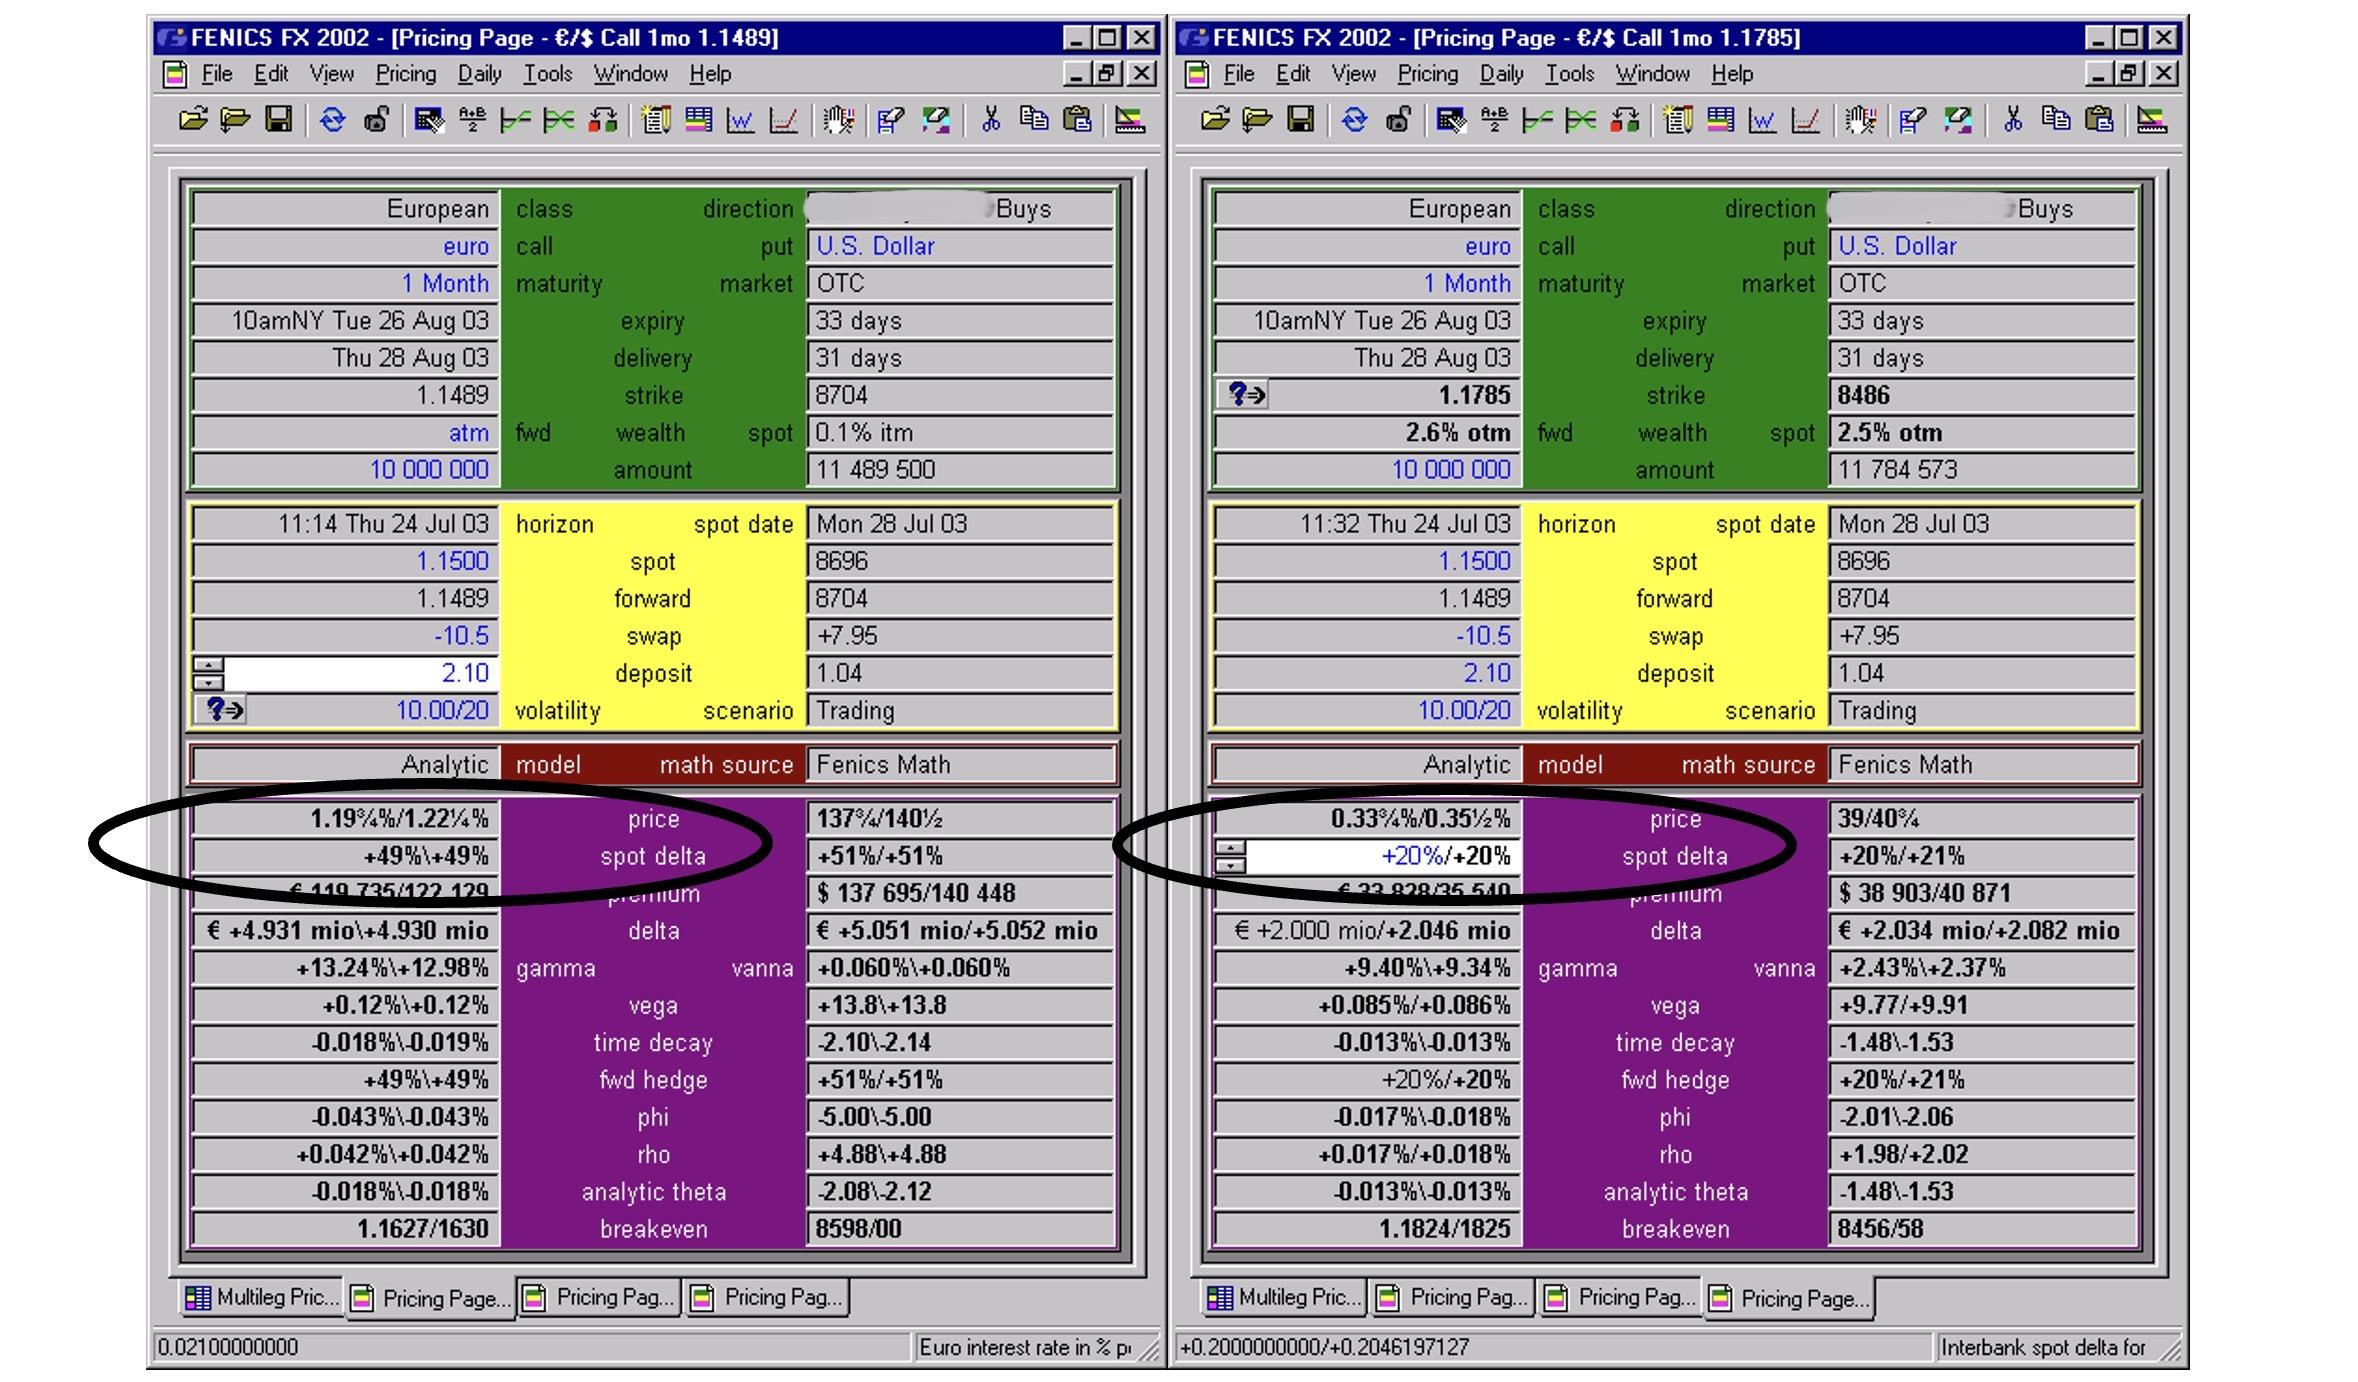
Another difference between ATM volatilities and OTM volatilities is the width of the price. The price of ATM options are more sensitive to volatility changes than OTM options. Therefore, if OTM and ATM volatility prices were the same width, in monetary terms the OTM option prices would get tighter the further out-of-the-money the option is as the vega of the option decreases. Clearly this would not be representative of the risk of the option nor of the liquidity of the underlying, which would be largely the same. To compensate, the prices in volatility terms are wider as the option gets further out-of-the-money. The price in monetary terms tends to stay fairly constant for options with different strikes (deltas).
The example below compares a 1 month ATM option with a 1 month 20 delta option with the volatility kept constant. Note that the ATM option is 2.5 basis points wide whilst the 20 delta option is 1.75 basis points wide.

Volatilities are dependent on the time to expiration of the option. The market’s expectations of actual volatility over one month can be significantly different to the expectations over one year. Current events can have a significant impact on shorter dated volatilities, hence, volatilities tend to change more in the short dates than the volatility to longer maturities.
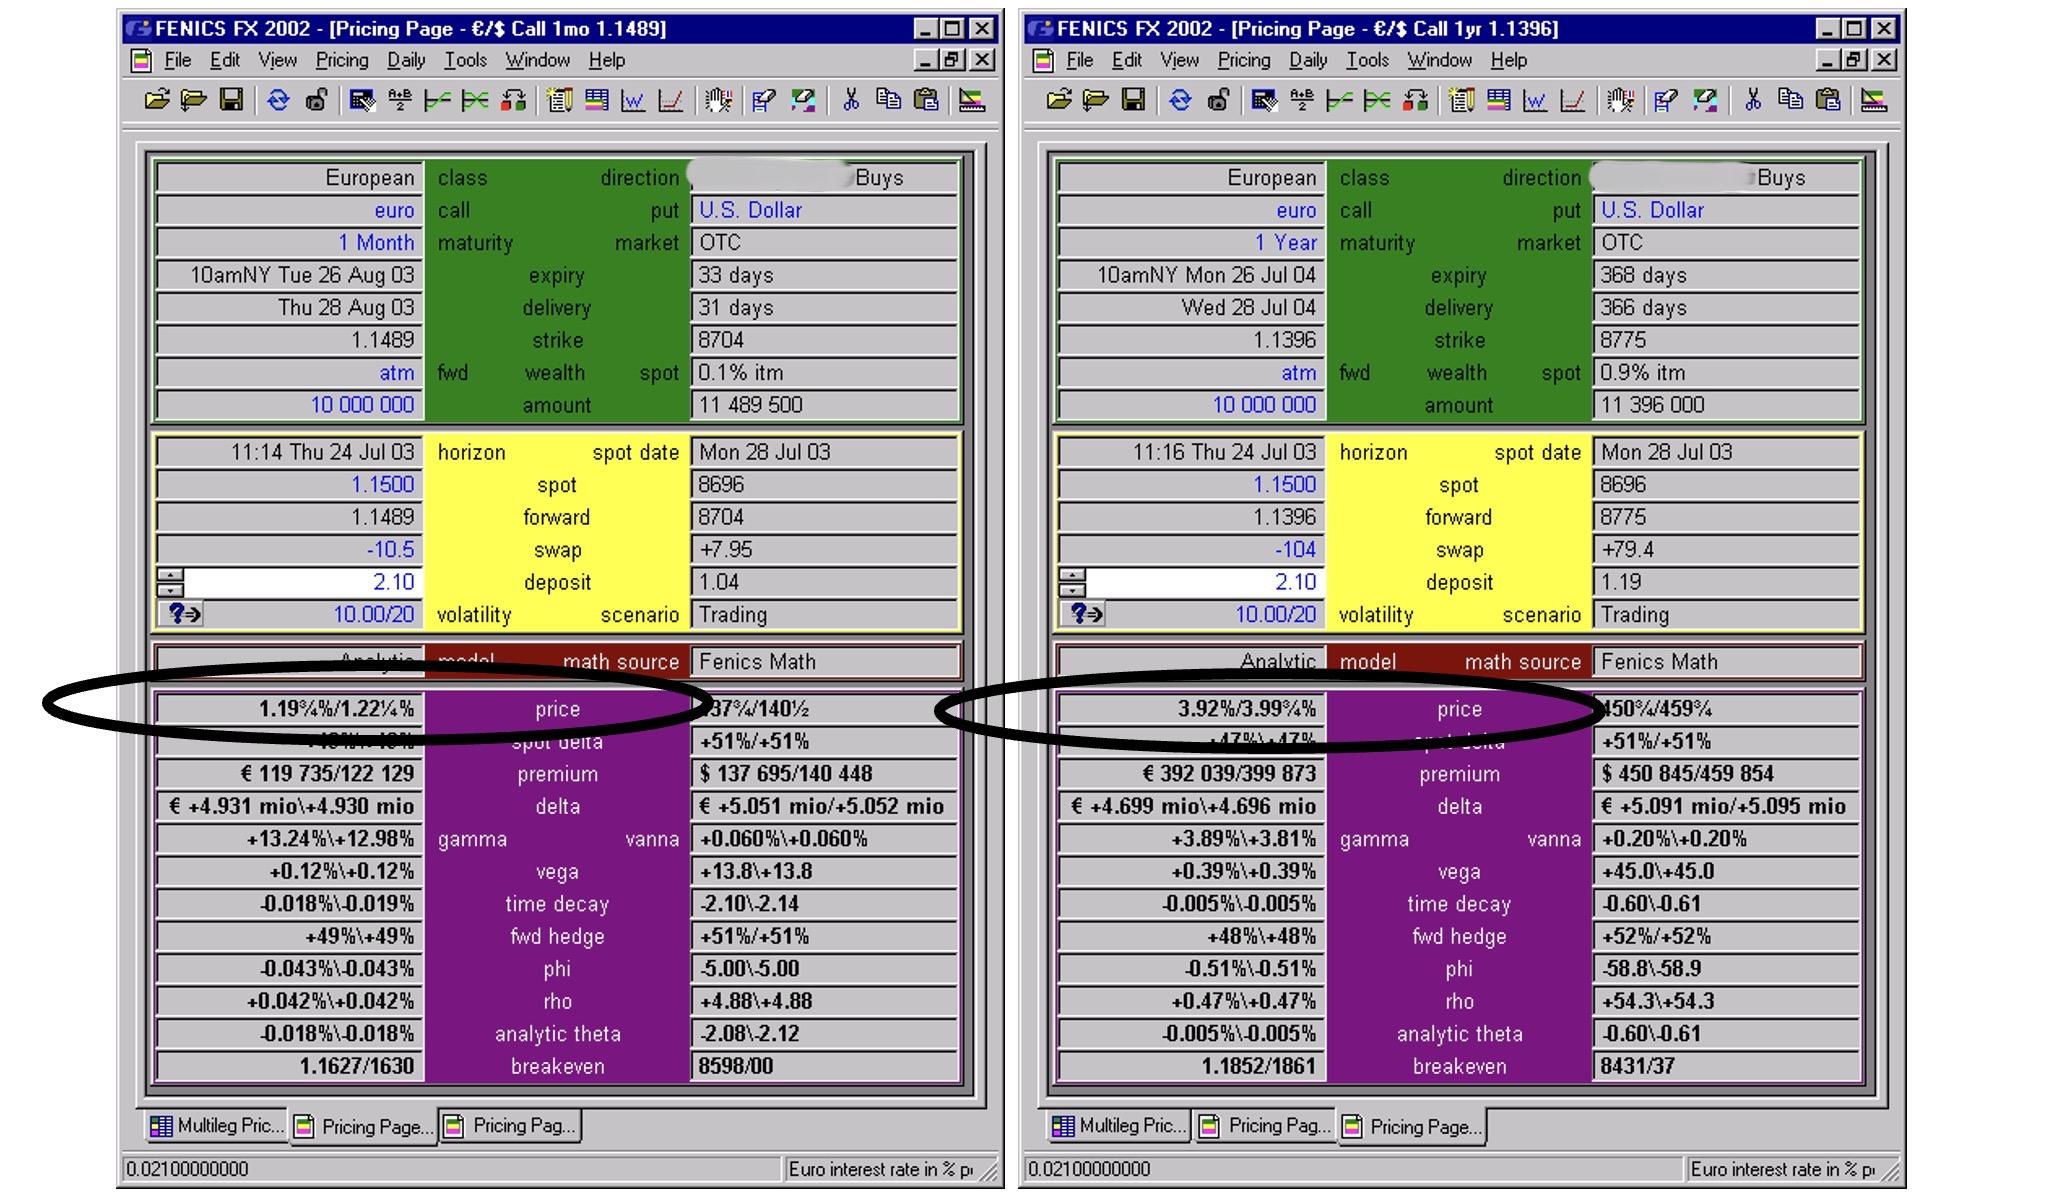
An option’s sensitivity to volatility increases as the time to expiration increases. Therefore, if short dated and long dated volatility prices were the same width in volatility terms then in monetary terms the short dated option prices would be tighter than the longer dated option. This would not be representative of the risk of the option. To compensate, the prices in volatility terms are wider as the maturity of the option decreases.
In the examples below 1 month and 1 year EUR/USD ATM options are compared. Note that the 1m option is 2.5 basis points wide whilst the 1y option is 7.75 basis points wide:

Volatilities for certain groups of currency pairs are closely related. For example, currency pairs that are USD versus European currencies will tend to move together. USD/CHF trades as a spread to USD/EUR, as does USD/SEK, etc. These spreads will change as market conditions change, and are traded by market makers, and sophisticated clients. Knowing the key relationships between different currency pairs enables market makers to quote volatilities for a wide range of currency pairs. For example, to quote SEK/JPY the market maker will use EUR/JPY volatilities as a starting point, then by looking at EUR/SEK volatility, and considering the correlation can make a SEK/JPY price.
As mentioned earlier, the more out of the money an option is, the less sensitive it is to volatility. For far out of the money options this can result in prices in monetary terms being very low. Special care has to be taken to ensure that prices are not below the market maker’s minimum price in monetary terms, and that the bid/ask width is appropriate. It is important to remember that if the volatility being quoted is for an option with a delta less than 10, it may take a trader a little longer to quote.
Historical volatility is generally calculated in two ways. The first and most commonly used calculation is based on the returns of spot based on daily closing rates. The second type of historical volatility calculation takes into account the daily range in spot by incorporating the daily high and low as well as the closing rate into the calculation.
The calculation of historical volatility using the daily closing rates of spot involves a number of steps. First the daily returns in spot are calculated. The average daily return is determined for the period being observed. The difference between each days’ returns and the average is calculated and that number is squared. The “average difference squared” over the period being observed is known as the variance and the square root of the variance is the standard deviation. It is the standard deviation that is known as historical volatility and this number is generally shown as an annualised number so that it can be easily compared to implied volatility.
In the next section we continue our introduction to FX options by looking further into volatility.