Take Your Learning to the Next Level! See More Content Like This On The New Version Of Perxeive.
Get Early Access And Exclusive Updates: Join the Waitlist Now!
Take Your Learning to the Next Level! See More Content Like This On The New Version Of Perxeive.
Get Early Access And Exclusive Updates: Join the Waitlist Now!
I build businesses, both as independent startups and as new initiatives within large global companies. This series of posts is based on an FX Options training course that I delivered whilst contributing to building FX businesses at a number of investment banks. If you are looking to build a business and require leadership then please contact me via the About section of this website.
In this section we look at some of the derivatives that characterise the risk of an fx option. To get the most from this section you should first have covered the foundational knowledge including options terminology and types of options and looked at some common option strategies. You should also have covered how options are funded and how these funding techniques are used when combining options and options valuation.
In this section we look at the behaviour of options as the underlying variables change. In an earlier section we introduced the concept of Intrinsic Value and Extrinsic Value. The intrinsic value, or parity value is described as follows:
Call option intrinsic value = max[(Spot – Strike),0]
Put option intrinsic value = max[(Strike –Spot),0]
To better understand what this means we need to look at the value of an option over a range of spot values at different time intervals.The details of the first option are in the FENICS pricing page below:
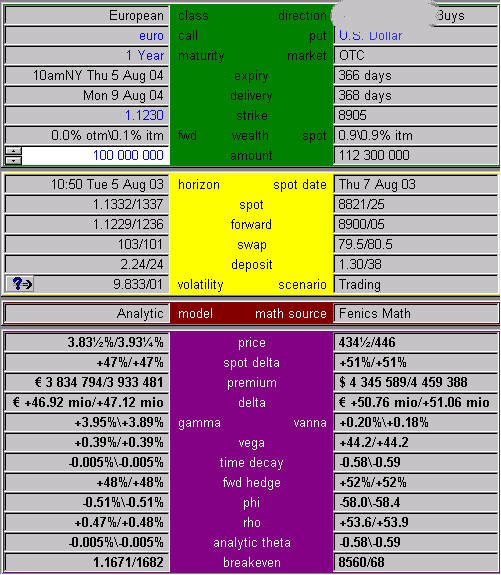
The value of the option over spot and time is shown in the FENICS chart below:
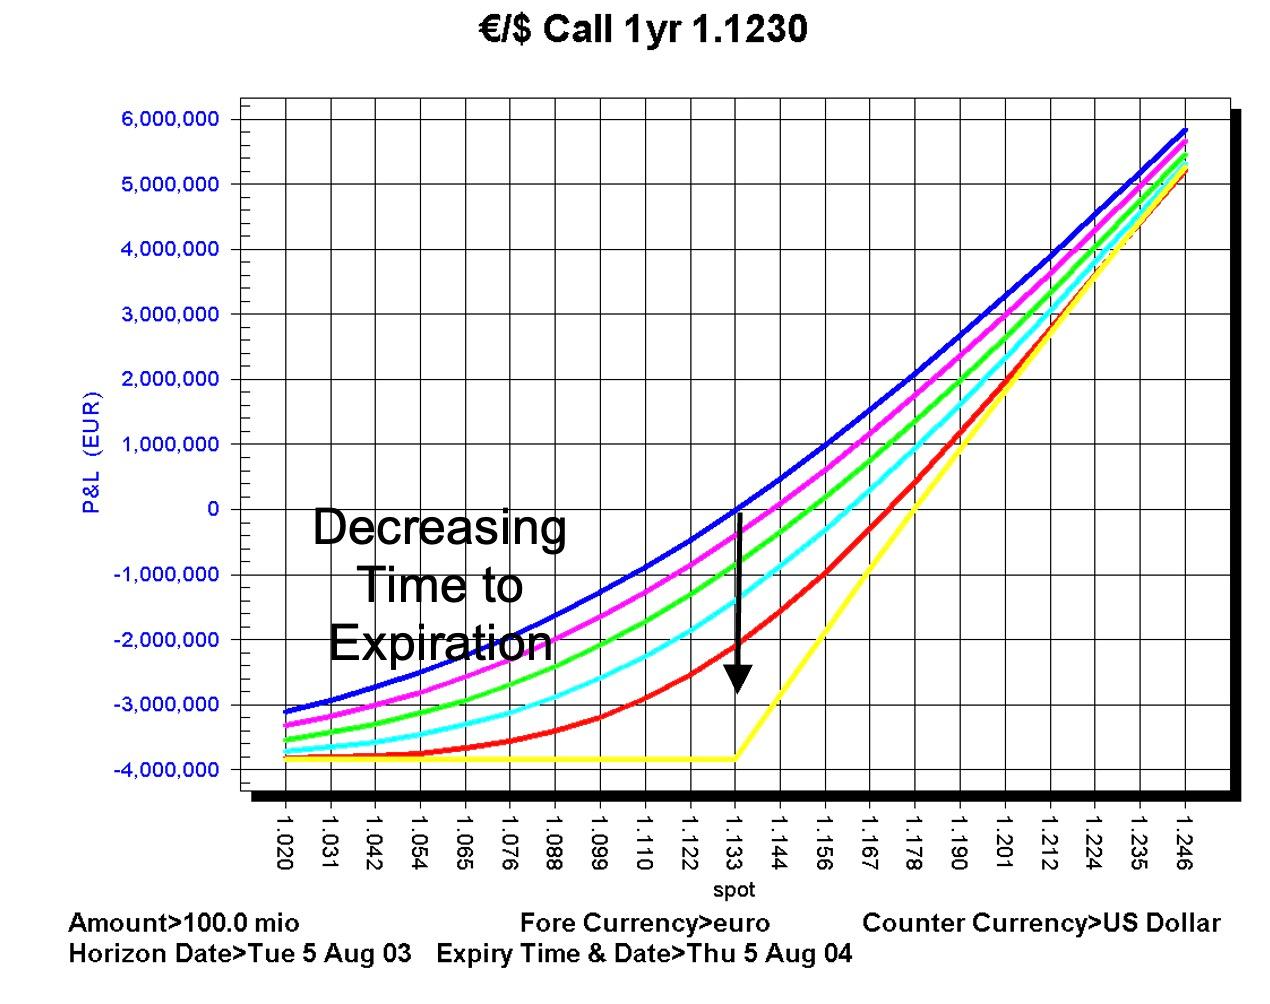
The botton line in the diagram, which is made up of two straight lines that are joined at the strike price represents the intrinsic or parity value of the option. This is the options value at expiration for a given spot value.
The other lines in the diagram represent the value of the option prior to expiration. These smooth lines represent the value of the option for different times to expiration. The line furthest from the intrinsic value represents a period furthest in time from expiration. For each successive line the time to expiration is decreasing.
Note, that as the time to expiration decreases the more curved the line becomes and the more it starts to resemble the intrinsic value.
The distance between the intrinsic value curve and the option value curve prior to expiration represents the extrinsic value of the option. This is greater the longer there is until expiration. This distance also increases for an increase in volatility.
Now look again at the curves that represent the option values over a range of spot prior to expiration. Note that the slope of the line changes for different spot values. If you were to draw a tangent to any of the curves and then repeat the process for a higher spot value then the slope of the option value curve for the call option in this example would be seen to increase in value.
The slope of the curve represents the change in value of the option for a change in spot. This is the delta of the option. The delta represents the hedge ratio. If you are long the option then by being short an amount of the underlying equal to the delta of the option then for small changes in spot your “delta hedge” will change in value by the same amount as the option.
The FENICS chart below shows the delta of options to different maturities change over a range of spot values:
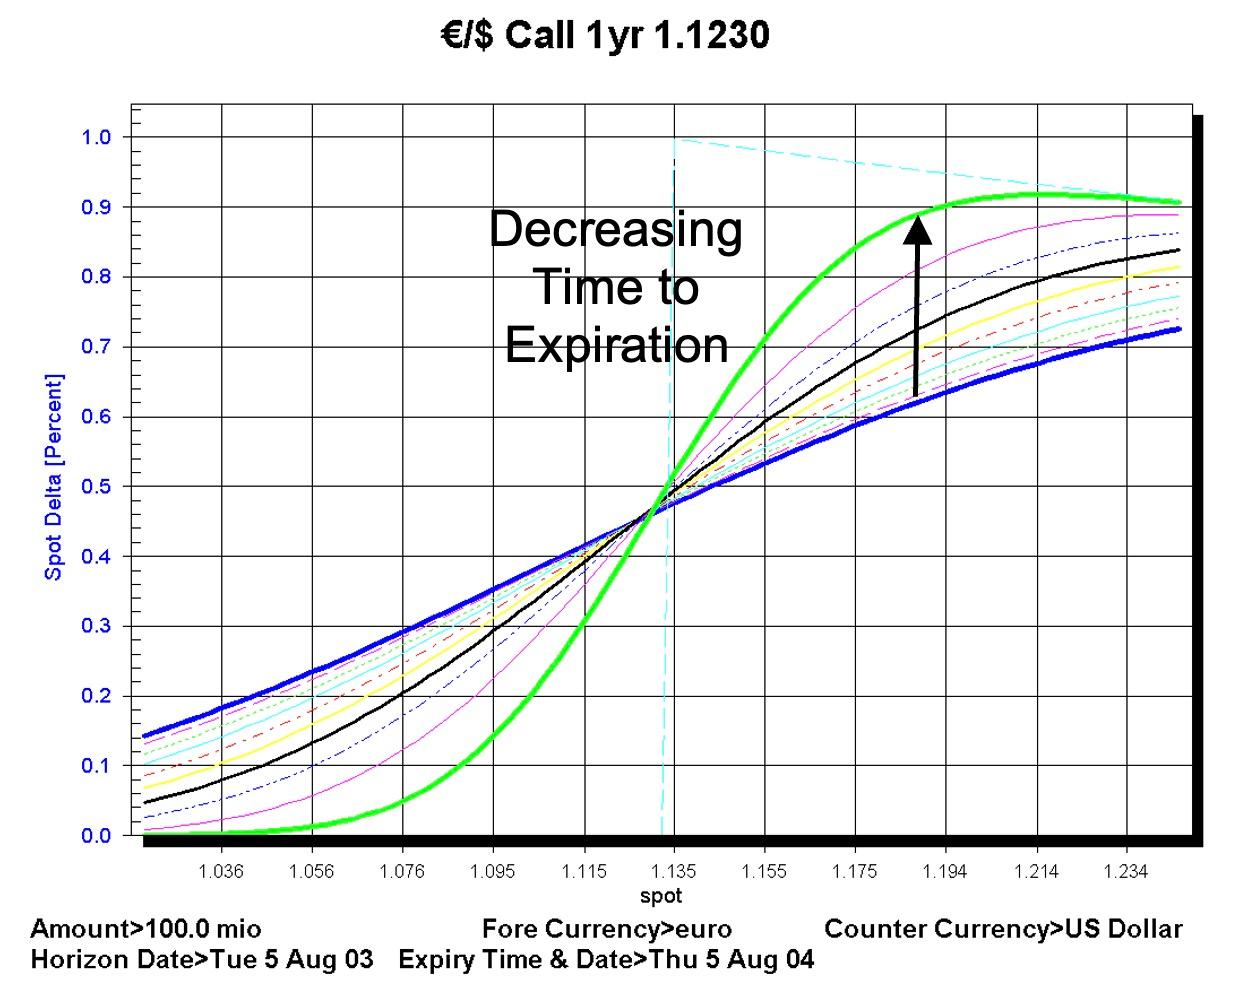
Note also that the delta itself changes for different spot values and for different times to maturity. The curves that are relatively flat in this diagram represent the the options with the greatest time remaining to expiration. As the time to expiration reduces the curve becomes far more curved.
The slope of the delta curve itself is interesting in that its rate of change with respect to changes in spot is most dramatic around the strike price.
The change in delta for a change in spot is the gamma of the option. It is also sometimes reffered to as the convexity of the option with respect to spot.
Gamma tells an options trader by how much the delta will change for a given move in spot. Since option traders delta hedge their portfolios gamma tells them how much of spot they will need to trade for a given move in spot in order to remain delta hedged.
The FENICS chart below shows the gamma of options of different maturities over a range of spot values:
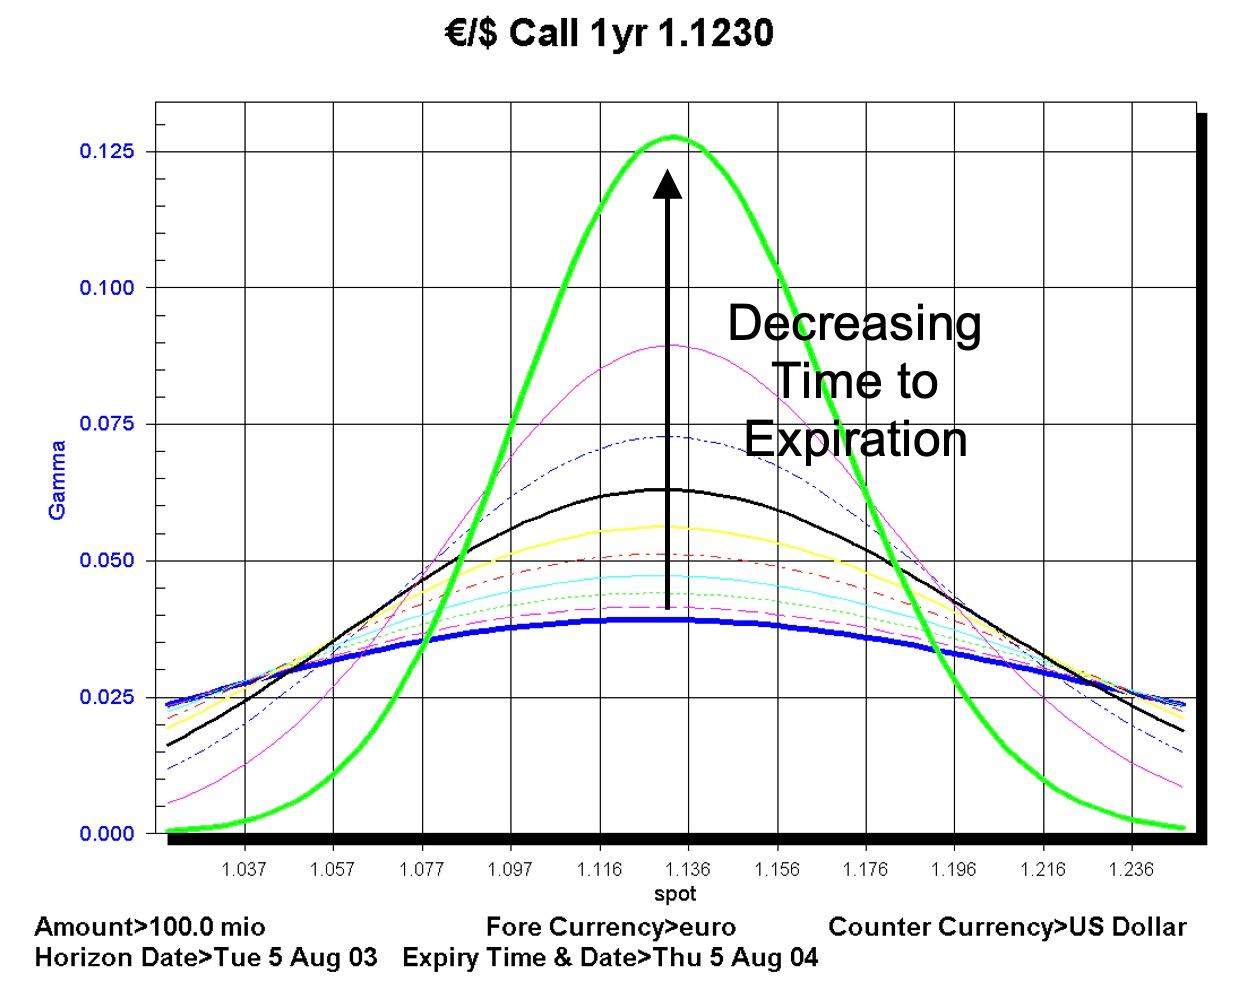
Note that as the time to expiration decreases the range of values for which gamma is relevant also decrease. The most important points highlighted by the chart are:
The other important risk characteristic of an option that needs to be understood is the sensitivity of the value of an option for a change in volatility. The change in value for a change in volatility is known as the vega of an option.
The FENICS chart below shows the change in vega for options of different maturities over a range of spot values:
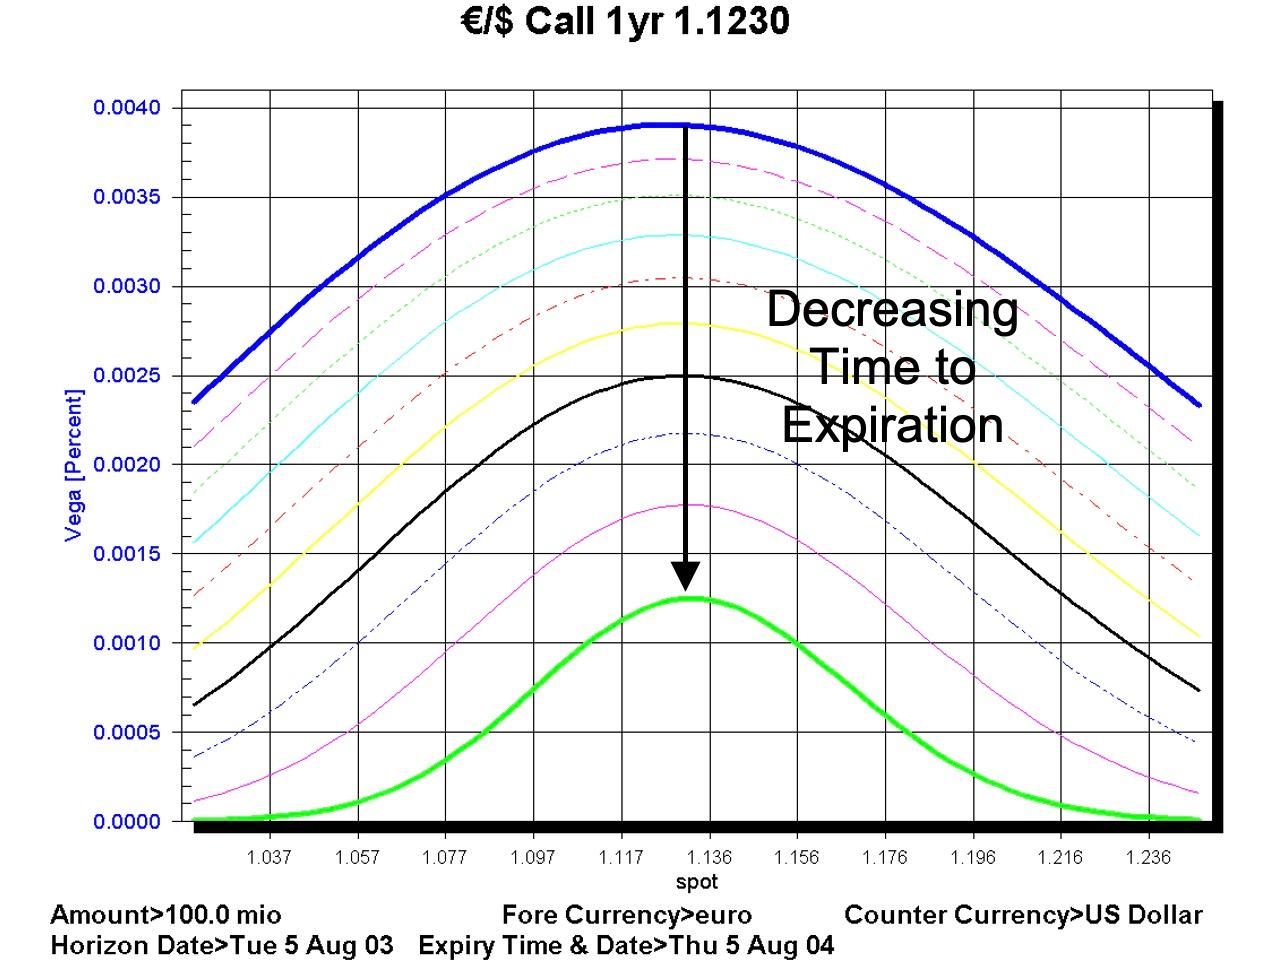
There are two important points that are highlighted by the chart:
In the next section we continue our introduction to FX options by looking at gamma.